This project visualizes flu shot compliance across a healthcare system in 2022. Using Tableau, it tracks vaccination rates by age, race, and region to uncover trends, support targeted outreach, and promote informed public health decisions.

Details
SQL
Tableau
Product Presentation
Libraries
Story Telling
Data Visualization
Overview
This project presents an interactive dashboard analyzing flu shot compliance across a regional healthcare system for the year 2022. Using a combination of demographic, geographic, and temporal data, the dashboard reveals patterns in vaccination behavior across age groups, racial demographics, and counties. The visualization highlights disparities in flu shot uptake, tracks progress throughout the year, and provides both high-level compliance metrics and individual-level details.
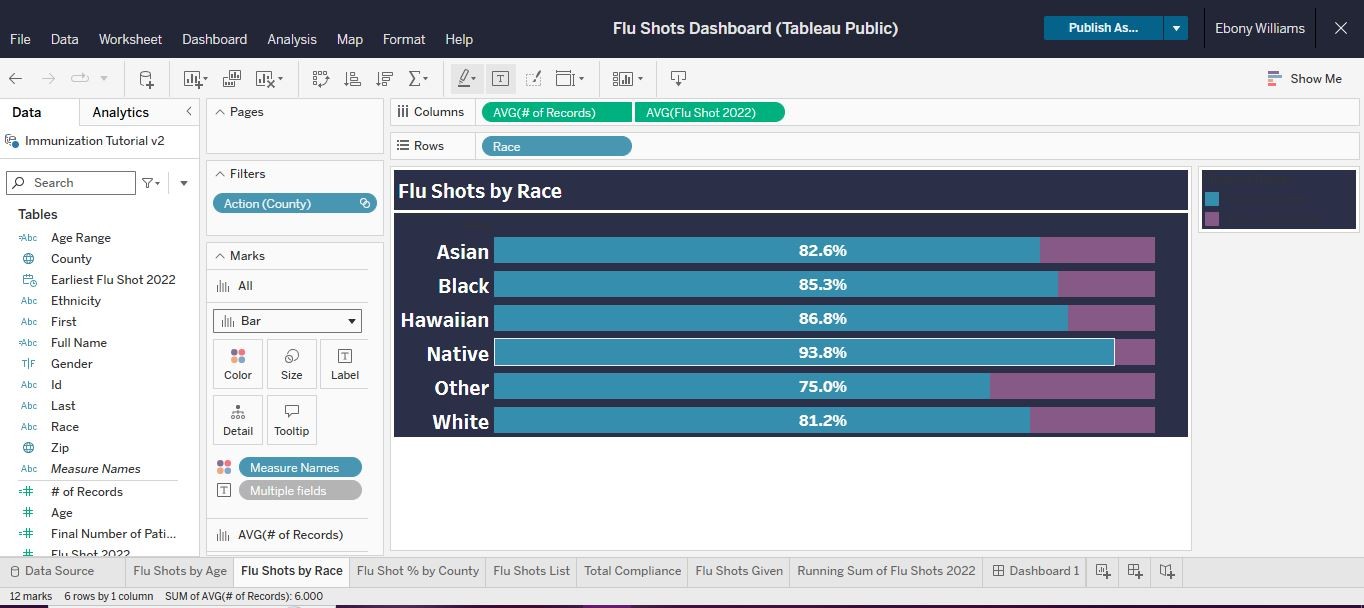
The dataset includes over 4,000 records of flu shots administered and calculates an overall compliance rate of 81.7%. Breakdowns by age show particularly high compliance among children (0–17) and older adults (65+), while younger adults (18–34) had significantly lower rates. Racial comparisons indicate strong participation among Native and Hawaiian groups, while the “Other” and White categories show room for improvement.
In addition to demographic analysis, the dashboard features a geographic map highlighting flu shot percentages by county and a running total graph that visualizes the pace of vaccination efforts month-over-month. This visualization offers healthcare professionals, public health teams, and policymakers a powerful tool to monitor vaccination efforts and direct resources to populations or regions with lower uptake.
By transforming raw vaccination data into a clear and intuitive dashboard, the project enables data-informed decision-making to strengthen community immunity and improve overall public health outcomes.
Key Features
Demographic Analysis: Assessed flu shot rates across age ranges and racial groups, revealing highest compliance among those aged 50–64 (95.6%) and Native populations (93.8%).
Geographic Mapping: Visualized county-level flu shot percentages using a map to pinpoint regions with high or low compliance.
Cumulative Tracking: Displayed the running sum of flu shots given from January through November 2022, highlighting seasonality and compliance growth.
Compliance Metrics: Calculated total compliance rate (81.7%) and flu shots administered (4,023), providing KPIs for performance monitoring.
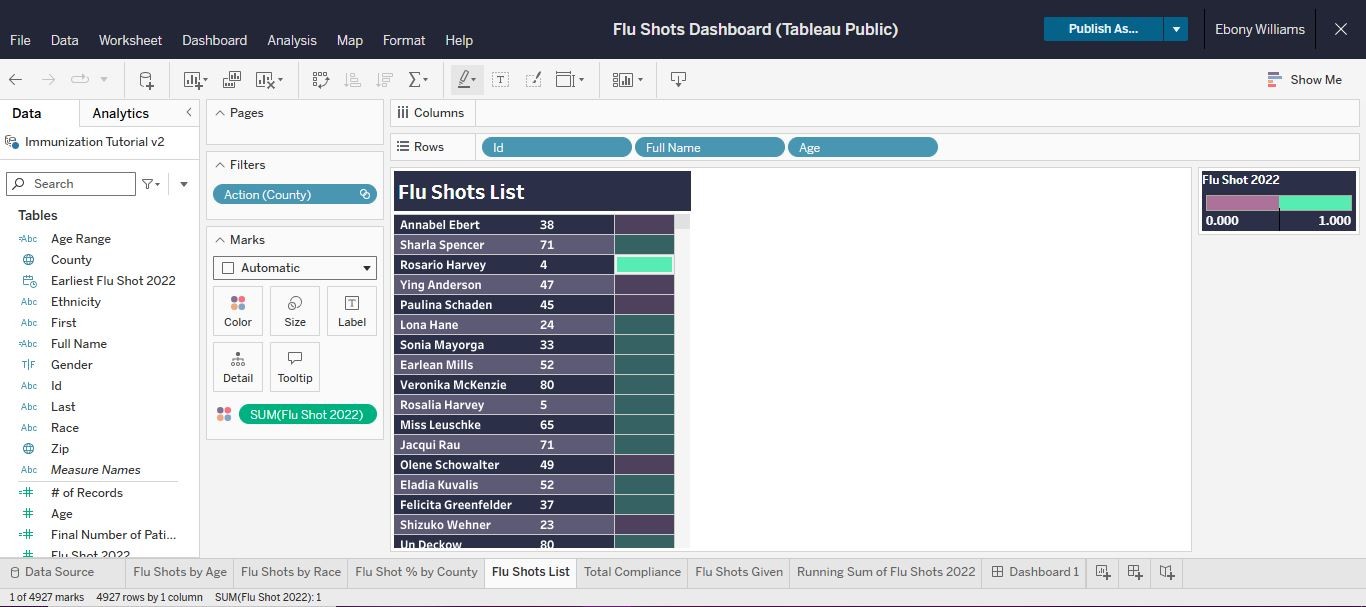
Patient-Level Insights: Included an individual flu shots list with names and status indicators, supporting granular-level analysis for targeted outreach.
Mission
The mission of this project is to leverage vaccination data to enhance public health initiatives by understanding patterns in flu shot compliance. By analyzing trends across demographics and regions, the project aims to identify disparities in vaccination coverage and support strategic efforts to increase accessibility, especially in underserved populations.
Impact
This dashboard offers clear, actionable insights for healthcare administrators and policymakers. It identifies demographic groups with lower vaccination rates (e.g., adults aged 18–34 and racial category labeled “Other”), suggesting a need for targeted outreach. The geographic component helps allocate resources efficiently by spotlighting areas with lagging compliance. By integrating individual- and population-level data, this project empowers public health professionals to implement data-informed strategies and improve overall immunization efforts.